
Table of Contents
Introduction
When working on database environments, one of the most common issues every DBA encounters is high CPU utilization. Typically, the application team approaches the DBA and reports that their queries are taking longer than usual or the application is slower. They request an investigation, and the first step a DBA usually performs is checking the CPU load on the database server.
In this article, we will explore a detailed, step-by-step guide on how to effectively diagnose and resolve High CPU issue in Oracle 19c.
How to resolve the High CPU issue in Oracle 19c
We need to follow the steps below to diagnose and resolve the High CPU utilization issue in Oracle.
1. Log in to the Server and run the top command
When you run the top command, you will get the following output, where you can see which process ID is consuming high CPU. We can see in the output below that the 7553 PID is consuming high CPU.

2. Check the Active Session details
Now, check the Active session details using the query below, which excludes Oracle default users and shows the result of only the Application user. In case you want to add Oracle users, you can modify the query and use it accordingly.
SET LINES 999 PAGES 999
col EVENT for a30
Col USERNAME for a30
alter session set nls_date_format='DD-MON-YYYY HH24:MI:SS';
select sysdate from dual;
col status for a10
col machine for a20
col username for a20
COL PROGRAM FOR A25
COL OSUSER FOR A15
COL USERNAME FOR a10
SELECT sid,serial#,STATUS, osuser,MACHINE,username,event,last_call_et,logon_time,sql_id
FROM gv$session where STATUS='ACTIVE' and username not in ('SYS','DBSNMP','SYSTEM','PUBLIC') order by logon_time;
Output

We can see from the above output that we obtained the SID and SERIAL# number, but we didn't see the PID together, which would allow us to easily identify that we are checking the correct details. We can move to step 3 to check the required query.
3. Find the SPID, SID, SERIAL# and SQL_ID details in a Single Query
You can use the query below to find the SPID, SID, SERIAL# and SQL_ID details in a Single Query and cross-check the SPID with the TOP command, which is consuming high CPU and Memory.
This query will also help to find out the long-running sessions with all the details in a single shot.
set lines 999 pages 999
alter session set nls_date_format='DD-MM-YYYY HH24:MI:SS';
col OSUSER for a10
col USERNAME for a10
col PROGRAM for a30
col SPID for a10
select p.spid, s.sid,s.serial#,s.username,s.osuser,s.sql_id,s.status,s.sql_hash_value,s.last_call_et,p.program,logon_time from v$process p, v$session s where s.paddr = p.addr and s.status = 'ACTIVE' and s.username not in ('SYS','DBSNMP','SYSTEM','PUBLIC') order by logon_time;
Output

4. Find out the SQL_TEXT from SQL_ID
Now we have the SQL_ID from the above output, now the turn is to find out the exact SQL_TEXT, which helps to find out more details.
set long 99999
select sql_id,sql_fulltext from gv$sql where sql_id IN ('&SQL_ID');
Output
SQL_ID       	                SQL_FULLTEXT
-----------------------      --------------------------------------------------------------------------------
33gwwwnxj2t1k	       insert /*+append parallel(8)*/ into soe.xtbl
				       select dbms_random.string('a','10'),
						xid.nextval,
					 decode(round(dbms_random.value(0,10)),0,'Chennai',1,'Canberra',2,'Berlin',3,
				'London',4,'Paris',5,'Washington',6,'Lisbon',7,'Madrid',8,'Mumbai',9,'Moscow',10
				,'Rome'),
					  decode(round(dbms_random.value(0,10)),0,'India',1,'UK',2,'Germany',3,'USA',4
				,'Italy',5,'France',6,'Spain',7,'Portugal',8,'Mexico',9,'Russia',10,'Australia')
				,
			decode(round(dbms_random.value(0,8)),0,'IT',1,'HR',2,'PAYROLL',3,'MAINTANENC
				E',4,'FOOD',5,'WELFARE',6,'HIRING',7,'MEDIA',8,'ENTERTAINMENT'),
					floor(dbms_random.value(1,10)),
					to_date(trunc(dbms_random.value(to_char(date '1979-01-01','J'),
													to_char(date '9999-12-31','J'))),'J'),
						floor(dbms_random.value(1,1000000))
				from (select level from dual connect by level <= 100),
				(select level from dual connect by level <= 100),
				(select level from dual connect by level <= 100)
5. Check Blocking Sessions
Before checking the other details, kindly check the blocking sessions as well, because sometimes it happens that a blocking session can occur because of the DML operations on the same tables.
If any blocking sessions are there, so first need to find out the details, and with the help of the application team, we need to kill the session to resolve the blocking issue.
set lines 200 pages 200
SELECT DISTINCT S1.USERNAME || '@' || S1.MACHINE
|| ' ( INST=' || S1.INST_ID || ' SID=' || S1.SID || ' ) IS BLOCKING '
|| S2.USERNAME || '@' || S2.MACHINE || ' ( INST=' || S1.INST_ID || ' SID=' || S2.SID || ' ) ' AS BLOCKING_STATUS
FROM GV$LOCK L1, GV$SESSION S1, GV$LOCK L2, GV$SESSION S2
WHERE S1.SID=L1.SID AND S2.SID=L2.SID
AND S1.INST_ID=L1.INST_ID AND S2.INST_ID=L2.INST_ID
AND L1.BLOCK > 0 AND L2.REQUEST > 0
AND L1.ID1 = L2.ID1 AND L1.ID2 = L2.ID2;
In our case, there is no blocking session present in the database.
Note: – Till this point, we have identified the SQL Query that is consuming the HIGH CPU with details, and that details can be shared with the application team, but we can share more details with the Application team that causes the High CPU issue in Oracle with the help of the below steps.
6. Check the details of the Schema and Tables
Next step is to check out the details of the table, like who is the owner, size, and then we can check the PLAN HASH value, whether it has changed from the past values.
Command to find the owner details of a table
=========================================

col owner for a20
col segment_name for a30
set lines 200 pages 200
select segment_name,owner,bytes/1024/1024 MB,segment_type from dba_Segments where segment_name IN ('&SEGMENT_NAME');

Output
=======

SEGMENT_NAME                   OWNER            MB    SEGMENT_TYPE
------------------------------ -------------------- ---------- ------------------
XTBL                                            SOE                  136       TABLE
7. Check the Stats and Lock status of the Tables
Command to check the Stats status of the table
===========================================

SET LINES 200 PAGES 200
COL OWNER FOR A30
COL TABLE_NAME FOR A30
COL PARTITION_NAME for a20
COL SUBPARTITION_NAME for a20
select table_name,OWNER,PARTITION_NAME,SUBPARTITION_NAME, stale_stats, last_analyzed from dba_tab_statistics where table_name IN ('&TABLE_NAME');

Command to check the Lock status of the tables
===========================================

column oracle_username format a15;
column os_user_name format a15;
column object_name format a37;
column object_type format a37;
select a.session_id,a.oracle_username, a.os_user_name, b.owner "OBJECT OWNER", b.object_name,b.object_type,a.locked_mode from
(select object_id, SESSION_ID, ORACLE_USERNAME, OS_USER_NAME, LOCKED_MODE from v$locked_object) a,
(select object_id, owner, object_name,object_type from dba_objects) b
where a.object_id=b.object_id;
Output

8. Check the Index and its Partition Stats
We can also check the index and its partition stats as well, because if there is an issue with the indexes, that may cause the HIGH CPU utilization issue in Oracle.
Command to check the Index stats
===============================

set lines 999
set pages 999
col LAST_ANALYZED for a30
col STALE_STATS for a20
col INDEX_NAME for a30
SELECT owner, table_name, index_name, last_analyzed, stale_stats FROM dba_ind_statistics  WHERE table_name='&TABLE_NAME' and owner = '&OWNER';

Command to check the status of the Index
=======================================

SELECT owner,index_name,table_name,status FROM dba_indexes WHERE table_name='&TABLE_NAME' and owner ='&OWNER';

Command to check the validity of index partitions (if partitioned)
===========================================================

SELECT index_name,partition_name,status FROM dba_ind_partitions WHERE  index_name = '&INDEX_NAME';
Output
Index Stats Output

Index Status Output

Index partition Output
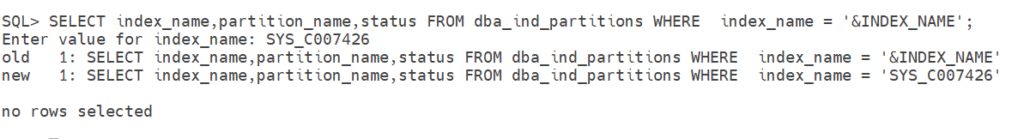
Note: – We can see from the above output that STALE_STATS of the XTBL table is showing YES, and also index stats have not been analyzed, which means the table and Index stats have not been gathered, which may cause the PLAN flip, also due to which the application team faces the HIGH CPU issue because the query might take a longer time to complete. Suppose if the PLAN has not flipped, then it is also recommended to gather the STATS of the Table and Index so that the Optimizer will generate or take the best plan for the query to avoid HIGH CPU and Long Running queries issues.
9. Find out the history of PLAN_HASH_VALUE for the SQL_ID
History of PLAN_HASH_VALUE for the SQL_ID
=========================================

set lines 999 pages 999
col END_TIME for a30
alter session set nls_date_format='mm/dd/yyyy hh24:mi';
SELECT
a.sql_id,
TO_CHAR (begin_interval_time, 'mm/dd/yyyy hh24:mi') as START_TIME,
TO_CHAR (end_interval_time, 'mm/dd/yyyy hh24:mi') as END_TIME,
plan_hash_value,
executions_delta,
rows_processed_delta,
ROUND (elapsed_time_delta / 1000000) / executions_delta
"Elapsed_per_exec_sec"
FROM dba_hist_sqlstat a, dba_hist_snapshot b
WHERE sql_id IN ('&SQL_ID')
AND a.snap_id = b.snap_id
AND executions_delta > 0
ORDER BY 2;
Output

Note: – In my case, the PLAN HASH VALUE has not changed. If, in your case, the PLAN HASH VALUE has changed, then you can see this article on how to resolve long-running queries in Oracle, and if you require some recommendations from Oracle, then you can use the SQL Tuning Advisor tool for the same, which helps to resolve HIGH CPU and long-running queries issues in Oracle.
10. Gather Table and Index Stats
Now we can gather the Table and Index stats to make the statistics up to date, which helps the optimizer to choose the best plan and helps to resolve the HIGH CPU issue in Oracle.
Table stats gather command
==========================

EXEC DBMS_STATS.gather_table_stats('&SCHEMA_NAME','&TABLE_NAME',cascade=>true,estimate_percent=>dbms_stats.auto_sample_size,degree=>dbms_stats.auto_degree);

If you are using cascade option in Table stats gather command then for that particlur table index stats will also gathered.

if you are not using cascade option then you can use below command to gather Index stats separately

EXEC DBMS_STATS.gather_index_stats('&OWNER','&INDEX_NAME', estimate_percent =>dbms_stats.auto_sample_size);
Command to rebuild the Index and Partitioned Index
===============================================
alter index <index_name> rebuild online;
alter index <index_name> rebuild partition <partition_name> online;
Note: – After performing all the steps, I asked the application team to re-run the query and then check the CPU Utilization.
11. High-Level Points that are the reason for the HIGH CPU issue in Oracle
High CPU utilization normally means that Oracle sessions are using more CPU than the normal usage.
1) The first step is to check the CPU Utilization using the TOP command.
2) Determine which Oracle processes are using a lot of CPU power and associate them with database sessions.
3) Determine which SQL query is causing the HIGH CPU utilization.
4) Bad execution plans, missing indexes, outdated statistics, and costly SQL operations like complete table scans or big joins are frequently the causes of high CPU.
5) Check out the AWR/ASH report as well to identify the SQL which causing HIGH CPU.
6) CPU performance problems can be caused by recent program deployments, abrupt data expansion, or parameter changes.
Conclusion
In this article, we have seen the above steps on how to resolve the High CPU issue in Oracle 19c.
If you enjoyed the article, please leave a comment and share it with your friends. Also, let me know which Oracle and MySQL topics you'd like to see covered in future articles.
Note: – If you want to practice this whole activity in your home lab, then you'll need a platform to perform the installation. To set that up, you first need to download and install Oracle VirtualBox, followed by the operating system, the Oracle binary software, and finally, create the database.


Some truly nice stuff on this site, I love it.