Table of Contents
Introduction
Oracle database is powerful and used by almost all companies in their environment to handle their data. Oracle is known for its strong performance, scalability, and dependability, along with various features like Backup and recovery, Security, High availability, and many more.
In this article, we will explore a detailed, step-by-step guide on how to effectively troubleshoot and resolve issues related to long running Queries in Oracle.
As we all know, whenever the application team experiences slowness or an SQL running slowly in Oracle, they often go straight to the DBA team without checking anything else. Their usual request is, "Please check the database. Our query was running perfectly fine yesterday, but today it's taking much longer to finish".
Today, we will explore a real-time scenario of long-running queries in Oracle, along with the steps and guidance to resolve them.

How to find the long running queries in Oracle
We need to follow the steps below to find the long running queries in Oracle.
1. Login and check the status of the Database
set lines 250 pages 250
col HOST_NAME for a15
col DB_Start_Time for a20
SELECT NAME as DB_NAME,OPEN_MODE,instance_name,status,HOST_NAME,database_role,logins,to_char(startup_time,'DD-MON-YYYY HH24:MI') DB_Start_Time FROM
gV$INSTANCE,v$database;
2. Check the Blocking Session
set lines 200 pages 200
SELECT DISTINCT S1.USERNAME || '@' || S1.MACHINE
|| ' ( INST=' || S1.INST_ID || ' SID=' || S1.SID || ' ) IS BLOCKING '
|| S2.USERNAME || '@' || S2.MACHINE || ' ( INST=' || S1.INST_ID || ' SID=' || S2.SID || ' ) ' AS BLOCKING_STATUS
FROM GV$LOCK L1, GV$SESSION S1, GV$LOCK L2, GV$SESSION S2
WHERE S1.SID=L1.SID AND S2.SID=L2.SID
AND S1.INST_ID=L1.INST_ID AND S2.INST_ID=L2.INST_ID
AND L1.BLOCK > 0 AND L2.REQUEST > 0
AND L1.ID1 = L2.ID1 AND L1.ID2 = L2.ID2;
3. Find the long running session
ACTIVE Sessions Details
SET LINES 999 PAGES 999
col username for a15
col sql_id for a15
alter session set nls_date_format='DD-MON-YYYY HH24:MI:SS';
select sysdate from dual;
col status for a10
col machine for a20
COL PROGRAM FOR A25
COL OSUSER FOR A15
COL USERNAME FOR a30
col EVENT for a20
SELECT sid,sql_id,serial#,STATUS, osuser,username,last_call_et, logon_time,state
FROM gv$session where STATUS='ACTIVE' and username not in ('PUBLIC') order by logon_time;
INACTIVE Sessions Details
SET LINES 999 PAGES 999
col username for a15
col sql_id for a15
alter session set nls_date_format='DD-MON-YYYY HH24:MI:SS';
select sysdate from dual;
col status for a10
col machine for a20
COL PROGRAM FOR A25
COL OSUSER FOR A15
COL USERNAME FOR a30
col EVENT for a20
SELECT sid,sql_id,serial#,STATUS, osuser,username,last_call_et, logon_time,state
FROM gv$session where STATUS='INACTIVE' and username not in ('PUBLIC') order by logon_time;
Long Running Session Details
set lines 999
set pages 999
SELECT SID, SERIAL#, CONTEXT, OPNAME, SOFAR, TOTALWORK,
ROUND (SOFAR/TOTALWORK*100, 2) "% COMPLETE"
FROM V$SESSION_LONGOPS WHERE TOTALWORK! = 0 AND SOFAR <> TOTALWORK;
Output

4. Find the SPID, SID and SQL_ID details in a Single Query
We can find the SPID, SID and SQL_ID details in a Single Query and crosscheck the SPID with the TOP command, which is consuming high CPU and Memory.
set lines 999 pages 999
alter session set nls_date_format='DD-MM-YYYY HH24:MI:SS';
col OSUSER for a10
col USERNAME for a10
col PROGRAM for a30
col SPID for a10
select p.spid, s.sid,s.serial#,s.username,s.osuser,s.sql_id,s.status,s.sql_hash_value,s.last_call_et,p.program,logon_time from v$process p, v$session s where s.paddr = p.addr and s.status = 'ACTIVE' and s.username is not null order by logon_time;
Command to find SID from PID
col sid format 999999
col username format a20
col osuser for a15
COL USERNAME FOR A12
col machine for a20
select b.spid, a.sid, a.serial#, a.username, a.osuser
from v$session a, v$process b
where a.paddr= b.addr
and b.spid='&pid'
order by b.spid;
Command to find PID from SID
Set lines 200
col sid format 99999
col username format a15
col osuser format a15
select a.sid, a.serial#, a.username, a.osuser, b.spid
from v$session a, v$process b
where a.paddr= b.addr
and a.sid='&sid'
order by a.sid;
5. Find the SQL_TEXT for a SQL_ID
We got the SQL_ID from the above output and now need to find out the text from SQL_ID.
Command to find out the SQL_TEXT from SQL_ID
set long 99999
select sql_id,sql_fulltext from gv$sql where sql_id IN ('&SQL_ID');
Command to check the wait event
select sid,serial#,username,machine, event,sql_id from gv$session where sid ='&SID';
6. Check the Stats of the Tables
SET LINES 200 PAGES 200
COL OWNER FOR A30
COL TABLE_NAME FOR A30
COL PARTITION_NAME for a20
COL SUBPARTITION_NAME for a20
select table_name,OWNER,PARTITION_NAME,SUBPARTITION_NAME, stale_stats, last_analyzed from dba_tab_statistics where table_name IN ('&TABLE_NAME');
Output

Note: – We can check from the above output table is in the STALE state which is not good.
7. Find out the PLAN_HASH_VALUE for the SQL_ID
Command to find our PLAN_HASH_VALUE history for the SQL_ID
set lines 999 pages 999
col END_TIME for a30
alter session set nls_date_format='mm/dd/yyyy hh24:mi';
SELECT
a.sql_id,
TO_CHAR (begin_interval_time, 'mm/dd/yyyy hh24:mi') as START_TIME,
TO_CHAR (end_interval_time, 'mm/dd/yyyy hh24:mi') as END_TIME,
plan_hash_value,
executions_delta,
rows_processed_delta,
ROUND (elapsed_time_delta / 1000000) / executions_delta
"Elapsed_per_exec_sec"
FROM dba_hist_sqlstat a, dba_hist_snapshot b
WHERE sql_id IN ('&SQL_ID')
AND a.snap_id = b.snap_id
AND executions_delta > 0
ORDER BY 2;
Output

Note: – We can check from the above output PLAN_HASH_VALUE has been changed which picks up the terrible plan because it has not processed a single row, but it has taken lots of time due to the app team facing a slowness issue.
PLAN_HASH_VALUE can be changed due to some factors like :
a) Stats have not been gathered properly due to which Optimizer will not get updated statistics and as a result it may pick a bad plan.
b) If any changes are made in the SQL query by the application team then optimizes different plan hash values.
c) Performace issues also occur if there is a full table scan happening for large tables so we need to suggest the application team to do proper indexing, if we want to see some recommendations from Oracle we can use SQL TUNING ADVISOR for the same.
8. Gather the stats of the Table
We make sure to update the application team that they should inform the DBA team in advance if there are lots of DML statements running and tables are modifying regularly. So that the DBA team makes scripts and automates them with the help of CRON jobs or other tools to gather the stats of those tables at some intervals of time to avoid any STALE issues.
TABLE STAT Gather Script
execute dbms_stats.gather_table_stats('&SCHEMA_NAME','&TABLE_NAME',cascade=>true,estimate_percent=>dbms_stats.auto_sample_size,degree=>dbms_stats.auto_degree);
Command to check the STATS of a TABLE
SET LINES 200 PAGES 200
COL OWNER FOR A30
COL TABLE_NAME FOR A30
COL PARTITION_NAME for a20
COL SUBPARTITION_NAME for a20
select table_name,OWNER,PARTITION_NAME,SUBPARTITION_NAME, stale_stats, last_analyzed from dba_tab_statistics where table_name IN ('&TABLE_NAME');
Output

9. Query to Find Execution Plan Details
Command to find the Execution Plan so that we will get to know what all operations like Full Table Scan, Index Scan, Rows, CPU cost, and much more have performed in a Tree shape structure.
Execution Plan Details from Cursor for a SQL_ID
SET LINESIZE 150
SET PAGESIZE 2000
SELECT * FROM table (DBMS_XPLAN.DISPLAY_CURSOR('&SQL_ID'));
Execution Plan Details from AWR Repository for a SQL_ID
SET LINESIZE 150
SET PAGESIZE 2000
SELECT * FROM table (DBMS_XPLAN.DISPLAY_AWR(sql_id => '&SQL_ID', plan_hash_value => &PLAN_HASH_VALUE));
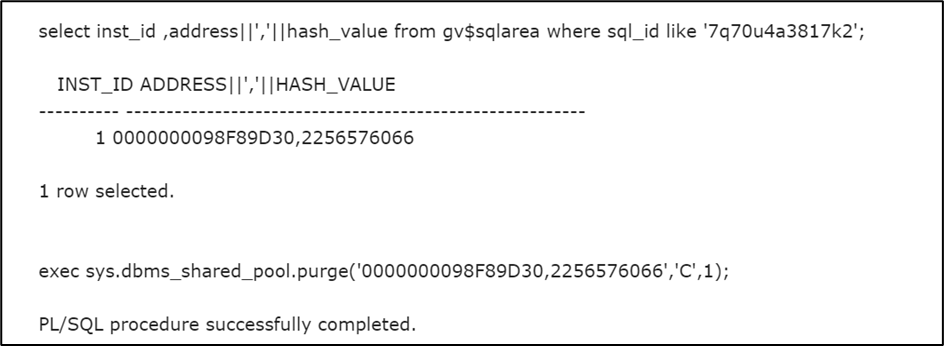
10. Purge the Shared Pool for the SQL_ID
set lines 999 pages 999
select inst_id ,address||','||hash_value from gv$sqlarea where sql_id like '&SQL_ID';
exec sys.dbms_shared_pool.purge('&ADDRESS,&HASH_VALUE','C',1);
Output
11. Pin the Good Execution Plan
We have to execute the coe_xfr_sql_profile.sql script to pin the good execution plan.
Output
sys@ORAXXXX> @coe_xfr_sql_profile.sql
Parameter 1:
SQL_ID (required)
Enter a value for 1: 7q70u4a3817k2 —————–> Enter the SQL_ID here
PLAN_HASH_VALUE AVG_ET_SECS
—————– ———————————
3583374745 2.858————————-> Good PLAN_HASH_VALUE (3583374745)
1194960972 9921.22————————> Bad PLAN_HASH_VALUE (1194960972)
Parameter 2:
PLAN_HASH_VALUE (required)
Enter a value for 2: 3583374745———————-> Enter the Good PLAN_HASH_VALUE
Values passed:
————–
SQL_ID : "7q70u4a3817k2"
PLAN_HASH_VALUE: "3583374745"
Execute coe_xfr_sql_profile_7q70u4a3817k2_3583374745.sql on the TARGET system to create a custom SQL Profile with plan 3583374745 linked to adjusted sql_text.
COE_XFR_SQL_PROFILE completed.
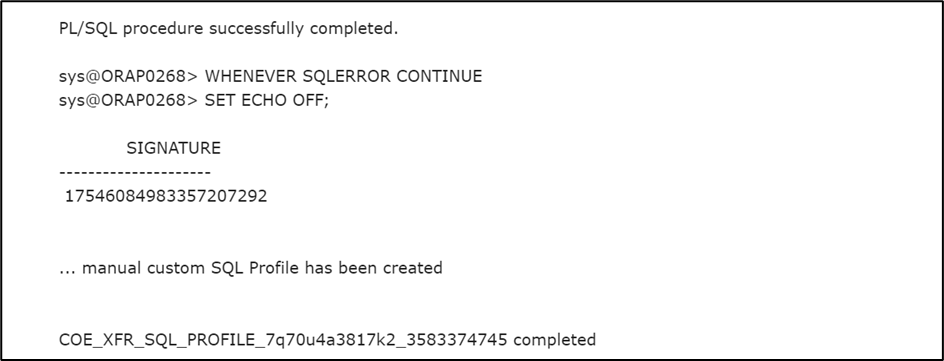
Note: – Now we need to execute coe_xfr_sql_profile_7q70u4a3817k2_3583374745.sql script to make the changes in the PLAN_HASH_VALUE for the SQL_ID.
Output
sys@ORAXXXX> @coe_xfr_sql_profile_
12. Check the status of the SQL Profile
set lines 999 pages 999
col CREATED for a30
col NAME for a40
col FORCE_MATCHING for a20
select NAME,TYPE,STATUS,FORCE_MATCHING,CREATED from dba_sql_profiles where NAME IN ('&SQL_PROFILE');
Output

Note: – After performing all the steps we asked the application team to re-run the query again and this time their query was completed in just a few minutes.
Conclusion
We have seen all the above steps which helped me to resolve the long running queries in Oracle. You can also take the reference if you face this type of issue in your environment.
FAQ's
How to stop long running queries in Oracle?
You can stop the long running queries by killing them but make sure you have approval from the application team.
Command to find the session details
==========================
SET LINES 300 PAGES 200
alter session set nls_date_format='DD-MON-YYYY HH24:MI:SS';
select sysdate from dual;
col status for a10
col machine for a20
col username for a20
COL PROGRAM FOR A25
COL OSUSER FOR A15
COL USERNAME FOR a10
SELECT sid,serial#,STATUS, osuser,MACHINE,username,event,last_call_et, logon_time, program,inst_id
FROM gv$session where STATUS='ACTIVE'and username not in ('SYS','DBSNMP','SYSTEM','PUBLIC') order by logon_time;
Command to Kill the long running queries
=============================
select 'ALTER SYSTEM KILL SESSION '||""||sid||','||serial#||','||'@'||inst_id||""||' '||'IMMEDIATE;' from gv$session where sid='&SID';
How to troubleshoot SQL query performance in Oracle?
You can troubleshoot SQL query performance in Oracle with the help of the above 10 steps in this article.
What to do if the query takes too long?
There are several reasons why of query takes too long to execute.
1) Check the Blocking Sessions
2) Gather the Stats properly at regular intervals.
3) We need to try to avoid a Full table scan for a table.
4) We need to check the CPU and MEMORY utilization.
5) Check if there is any plan flipped for a query.
Please note that using any items or information from this website is completely voluntary and at your own risk. They are provided purely for educational reasons. Although we have tested them internally, we cannot guarantee that they will perform as intended for you. Before applying, it is highly advised that you conduct a test in your non-production environment.

